Climate chaos in 10 charts: Why every fraction of a degree change in temperature matters
DIU, the data team of India Today, analysed the past 40 years' temperature data for four metro cities to trace unusual weather patterns in recent years.

")
By Dipu Rai: Weather events today, such as floods and heat waves, are more extreme than the so-called alarmist scientists predicted a decade ago. Parts of the world are drier than average, others extremely wet, and some face soaring temperatures. Climate chaos is now rampant in almost every corner of the world.
- Temperatures in the US, Asia, and Europe show climate change entering uncharted territory.
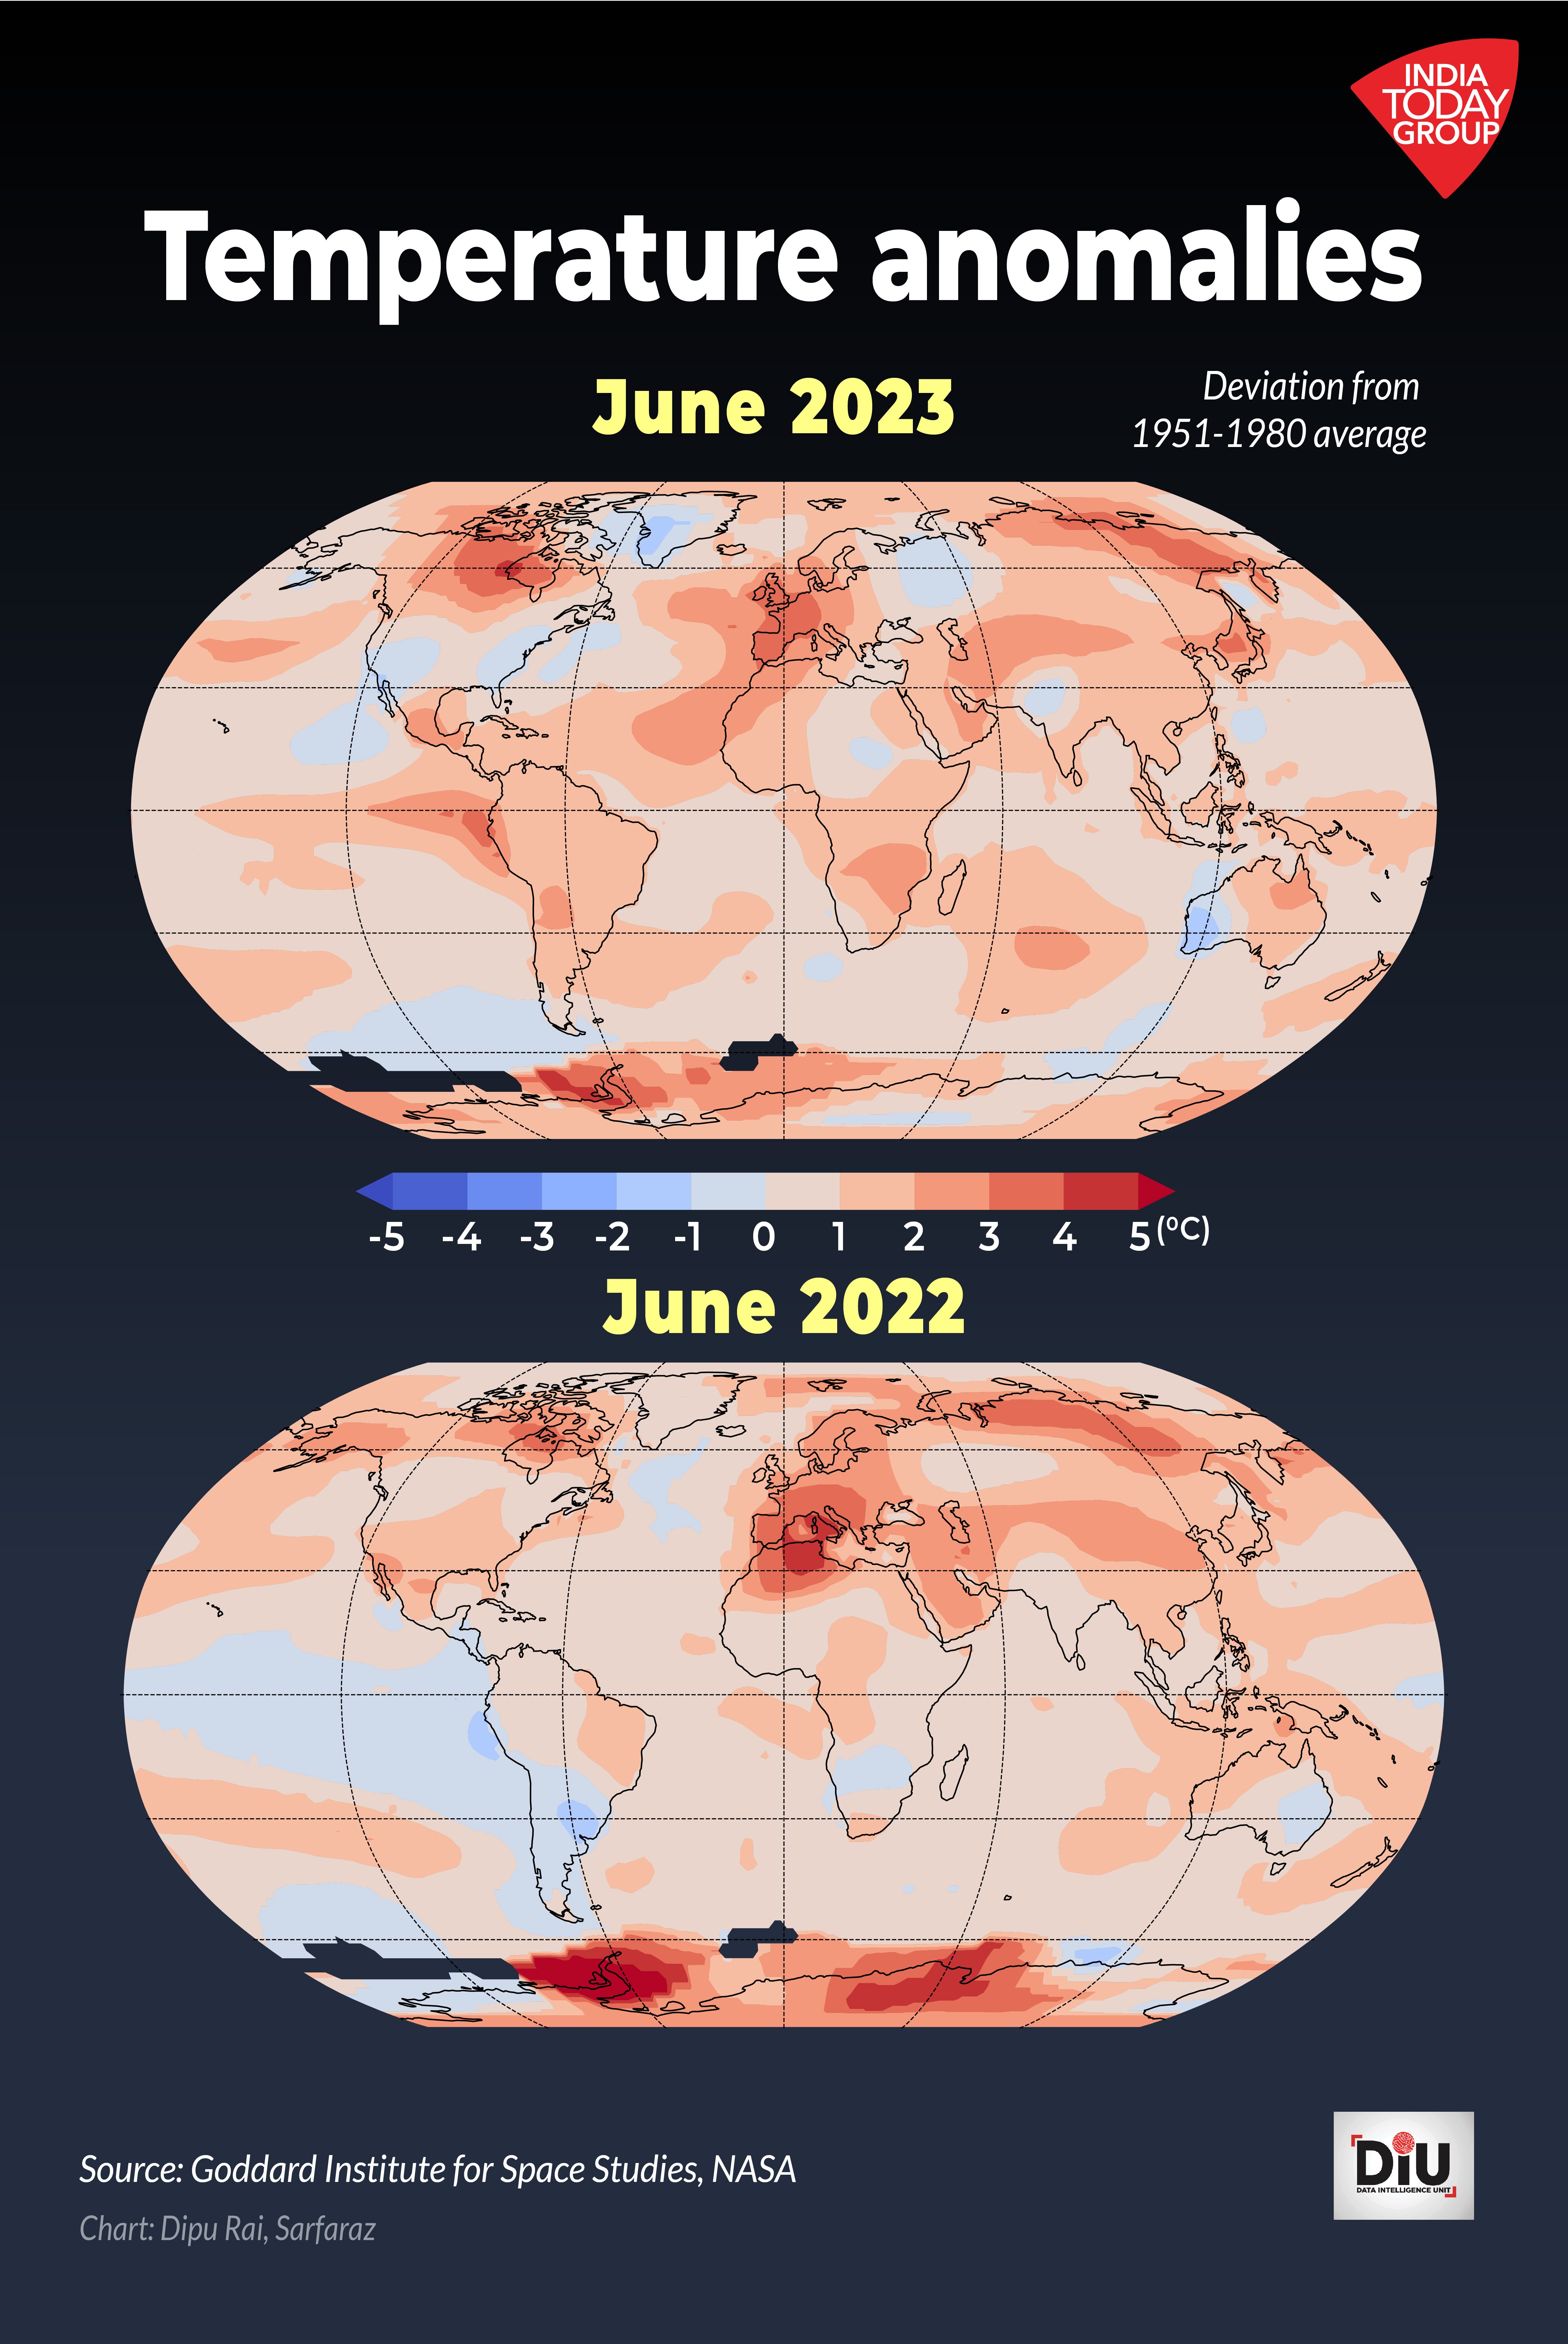
- Global average surface temperatures reached all-time highs in July, possibly the highest levels in at least 125,000 years.
- Sea surface temperatures reached a record high in May and the trend continued in June and July, with even bigger anomalies.
- July 3, 2023, was recorded as the hottest day ever, with an average global temperature of 17.01°C, crossing the August 2016 record of 16.92°C.
- New Delhi’s deluge on July 9 was the worst in 41 years.
- On July 16, the Sanbao in Turpan, China, recorded the highest temperature ever at 52.2°C.
- Phoenix in the U.S. broke the record for the most recent days above 43°C.
- Europe experienced extreme heat, reaching 46.3°C in Licata, Italy, and 45.4°C in Figueres, northeast Spain.
- Areas in the Persian Gulf hit extreme temperatures and humidity levels, intolerable for humans.
WHY IT MATTERS
Heat waves threaten public health and economic life. A 2020 study found that heat and humidity are now too severe for human tolerance.
This summer witnessed multiple heat domes forming over America, Europe, and Asia, which led to unusual heat waves in many regions.

IN NUMBERS
This summer has been unique. It began with the warmest June ever recorded, dating back 174 years. Temperatures kept rising in the following month and hit the warmest on July 6. Global temperatures are already 1.25°C above the pre-industrial average.
Between July 3 and July 19, there were 13 days with temperatures at or above 17°C for the global average surface temperature.
Every year, around 500,000 people die from extreme heat worldwide.
About 30 million people live in extreme heat, above the 29°C mean annual temperature.
Climate journalist Jeff Goodell's latest book, “The Heat Will Kill You First”, predicts that by 2070, this number will increase to around 2 billion.
Global agricultural production has decreased by approximately 21 per cent in the past 20 years due to climate-driven heat events and drought.

In June 2023, the North Atlantic recorded its warmest sea surface temperatures.
The average temperature was 0.91°C above usual. This surpassed the previous warmest June in 2010 by about 0.5°C.
The north-eastern Atlantic Ocean stood out the most, with temperatures 1.36°C above the average for the whole month, as shown in the chart below.
Ocean temperatures have risen consistently for over three decades. Scientists predict a further increase in global sea surface temperatures over the next decade due to greenhouse gas (GHG) buildup in the atmosphere.
INDIA'S RECORD-BREAKING RAINFALL
Dust storms in the Arabian Peninsula and fossil fuel emissions contribute to heavier seasonal rains in India.
This year saw record-breaking rains in many parts of the country from July 1 to July 10. Delhi, Chandigarh and Himachal Pradesh surpassed several records while some areas remained dry.
Over 100 people have died so far, and millions are in peril as extreme rains and floods hit India, especially Himalayan tourist spots in July this year.
For every degree Celsius of global warming, the Indian subcontinent can expect an additional 5.3 per cent of rain during the monsoon, according to estimates calculated by Earth System Dynamics, a German research institute.

Studies show that urban centres are experiencing a gradual rise in temperature and a surge in people's exposure to hazardous heat levels globally.
DIU, the data team of India Today, analysed the past 40 years' temperature data for four metro cities to trace unusual weather patterns in recent years.

Annual temperature and precipitation changes in cities are some of the most prominent markers of climate change.
According to data from the European Centre for Medium-Range Weather Forecasts (ECMWF), collated by Meteoblue, the June temperature of Delhi dropped by 1.5°C.
During this period, Mumbai's average temperature rose by 1.5°C. In other words, while Delhi is getting colder, Mumbai is witnessing an unusual temperature rise.

However, other metro cities like Chennai and Kolkata are experiencing an upward trend in temperature anomalies from a 30-year (1980-2010) climate mean.

WHY IS THIS HAPPENING?
When the steam engine was invented in 1769, carbon dioxide levels were estimated at around 250 ppm (parts per million, a unit of atmospheric concentration).
Then the temperature change almost hovered around 0°C. Over the years, CO2 levels have reached around 420 ppm, and global heat rose to about 1.20°C from normal (pre-industrial levels).

The Intergovernmental Panel on Climate Change report states that as per published scientific literature, only a tiny fraction of late-20th-century warming can be attributed to natural drivers and internal climate variability.
Further, global temperatures will likely soar to record highs in the next five years. According to forecasters at the World Meteorological Organization, human-caused warming and the climate pattern of El Niño are the driving forces.

ARE WE REACHING OUR LONG-TERM TEMPERATURE GOAL?
In December 2015, 196 parties signed the Paris Agreement, a legally binding international treaty on climate change under the United Nations Framework Convention on Climate Change.
The agreement aims to limit global warming to below 2°C by the end of the century, striving for 1.5 °C compared to pre-industrial levels.
A study in Nature stated global GHG emissions must halve by 2030 to meet Paris Agreement goals.

According to Climate Action Tracker (CAT), which tracks governments' climate action against Paris Agreement temperature goals, current policies seem least aware of the rising GHG emissions challenges.
Scientist James Hansen, who warned the world about the GHG effect in the 1980s, said recently that all this is happening because "we are damned fools" for not acting upon warnings about the climate crisis.
ALSO READ | Malaria alert! Mosquitoes on the move as temperature rises globally
ALSO READ | Climate change: Which countries will foot the bill?